Template Matching plugin to TSDP allows the researchers to perform efficiently
visualization, sorting, and analysis of neuronal signals (spikes).
Template Matching provides the user with an optimal array of
visual information about neuronal spikes in the data set, to allow
selection of spikes or sets of spikes felt to represents a good template.
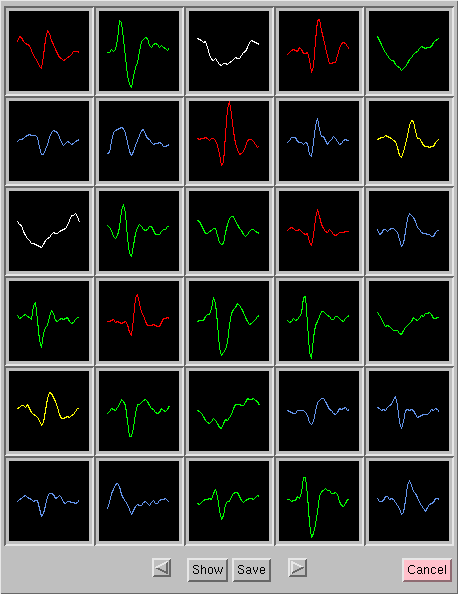
Sets of 30 spikes are viewed simultaneously in a 2-Dimensional array, and the user can page through an entire file of spike data to inspect separate sets of 30 spikes:

With this procedure it was found that it is relatively
easy to recognize the (typically) three or four distinct spike waveforms
present in any given spike record. One or an average of several spikes in
a common class can be made into a template with a few mouse clicks, and as
many as 5 distinct templates can be employed.
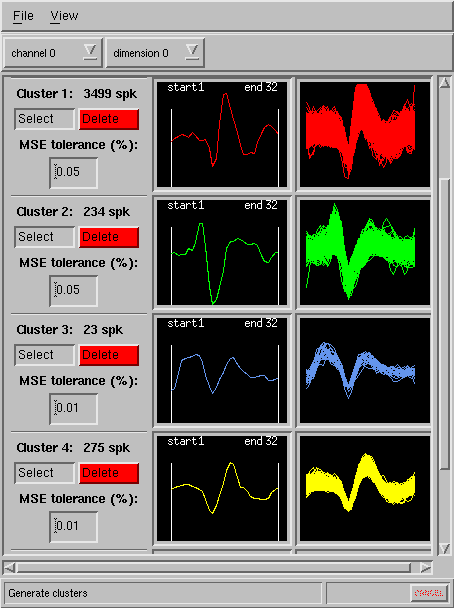
A mean square error criterion is then employed in determining the match of every spike in the
file to the chosen templates, and the results are quickly delivered as
spike overlay (cluster) displays:

The program allows user to choose the tolerance of the matching indivdually for each template. Specific time region to be matched (beginning and end of spike) can be conviniently set for each template by simply dragging the left and right borders in each template window with the mouse (see above).

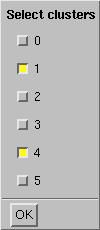
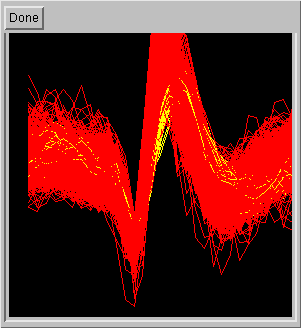
 Furthermore, cluster overlays can be obtained by selecting two or more
clusters on a choice box window (on the left). This allows the user
to quickly evaluate if the selected clusters have meaningfully different
wave shape (on the right).
Whereas spike sorting had been prohibitively time
consuming, the Template Matching tool has rendered it routine,
despite the large volumes of data recorded daily. It can operate on any time series data
regardless of its original raw data representation. The next step will be
to develop a TSDP-based plug-in, to process the data generated by Template Matching,
and to display it in histogram and correlogram format.